Discussion on the "Atmospheric Environmental Capacity"
The two heavy air pollution processes around the Spring Festival this year have once again attracted public attention. One person named "Lord Wu’an" found our paper "Simulation Study on Atmospheric Environmental Capacity Based on National City PM2.5 Compliance Constraints" (hereinafter referred to as "Capacity Paper") published in China Environmental Science in 2014, and then raised the "question of atmospheric capacity". Since the capacity of several pollutants obtained in the paper is equivalent to the discharge of several pollutants in current environmental statistics, why we still have haze? Is our governance direction wrong?
As the author of "capacity paper", first of all, I would like to thank "Lord Wu’an" for his attention to our research results. However, "Lord Wu’an"'s understanding of the basic content of the paper seems to be inadequate, which leads to biased inference. In fact, we have two important keywords in the title of the "capacity paper", namely "national cities" and"PM2.5 compliance constraint". This article discusses the upper limit of allowable pollutant emissions under the given meteorological conditions and the distribution pattern of pollution sources when the PM2.5 concentration in major cities above the national level reaches the target of 35 micrograms per cubic meter. After years of efforts, PM2.5 concentration in China has been declining rapidly in recent years. By 2019, the average PM2.5 concentration in 337 cities in China has dropped to 36 micrograms per cubic meter, and 53% of the cities have reached the PM2.5 annual average concentration standard; The emissions of air pollutants obtained by our statistics also keep a downward trend, and the current emissions of some pollutants are close to those obtained in the "capacity paper", which also reflects the correctness and effectiveness of the air pollution prevention and control route in recent years from another angle.
There are two conceptual confusions in “Lord Wu’an” understanding of "capacity paper", namely the confusion between the concept of "Beijing-Tianjin-Hebei" and "national". In 2019, the average concentration of PM2.5 in China's cities was 36μg / m³, close to the standard value of 35μg / m³, and the national pollutant emission was close to the national atmospheric environmental capacity. But this does not mean that the average concentration of PM2.5 in four key regions, 31 provinces and 337 cities has reached 35micrograms per cubic meter, nor that their pollutant emission is lower than the corresponding large one Gas environment capacity. It is particularly typical in Beijing-Tianjin-Hebei and the surrounding areas, where the average PM2.5 concentration in 2019 was still as high as 57μg / m³. This just shows that the emission intensity of pollutants in Beijing-Tianjin-Hebei and surrounding areas is still too large, which is more than 60% higher than the area's atmospheric environmental capacity. Therefore, it should be noted here that the national capacity and regional capacity are two different concepts, and the basic realization of national capacity is not contradictory to the situation that a certain region exceeds its capacity. For example, the average score of the whole class is 80, but some students may not exceed 60.
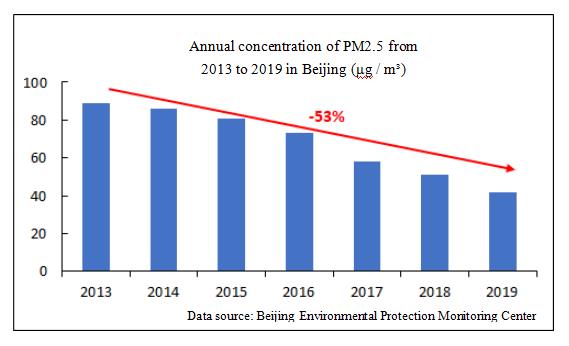
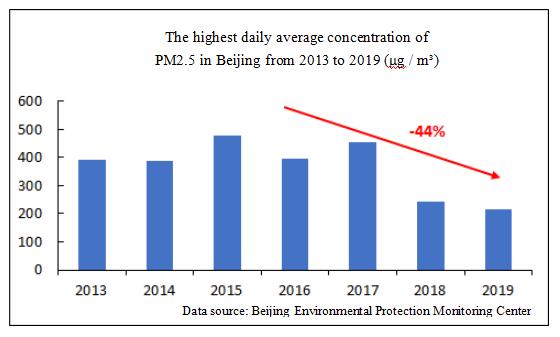
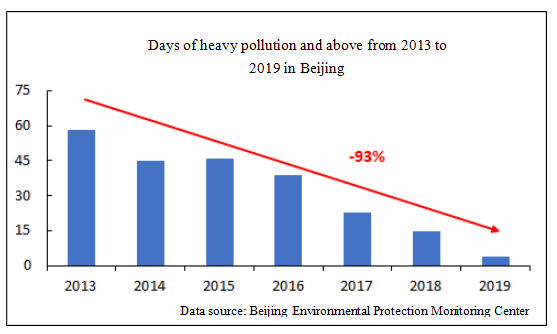
And the second is the confusion between the concepts of "heavy haze pollution" and "the annual average concentration of PM2.5 up to standard". We know that for the same emissions, the PM2.5 concentration will be very high if the weather conditions are very unfavorable; if the weather conditions are favorable, the PM2.5 concentration will be very low. And just in the past few days, we also experienced a roller coaster with PM2.5 concentration. On February 13, the concentration of PM2.5 in Beijing was 197 μ g / m³, and on February 15, it dropped to 6 μ g / m³. Comparing the two days, we found that the difference of air capacity in Beijing is more than 30 times. The "capacity paper" does not discuss the extreme scenario of "to what extent the pollutant emission will be reduced, then we will not have heavy pollution", but the annual average scenario of "to what extent the pollutant emission will be reduced under given meteorological conditions and pollution source emission distribution pattern, then our PM2.5 concentration can basically reach the standard". Of course, with the decrease of PM2.5 concentration throughout the year, the frequency, length and intensity of heavy haze pollution will be reduced. Taking Beijing as an example, from 2013 to 2019, the annual average concentration of PM2.5 decreased from 89 μ g / m³ to 42 μ g / m³, the highest daily average concentration of PM2.5 also decreased from about 400 μ g / m³ to about 200 μ g / m³ (see the figure below), and the days of heavy pollution were reduced from 58 days to 4 days. We believe that if we stick to the current direction of work, the heavy pollution of haze will be further reduced, and finally be eliminated.
Like all scientific research, the study of atmospheric environmental capacity is also in the process of continuous deepening. Therefore, we also welcome the whole society's workers who are interested in this to further exchange with us, to conduct in-depth research together, to offer suggestions for improving China's atmospheric environment, and to make the blue sky wider and wider.


 京公网安备 11010702002483
 Home
Home